 |
| (Image taken from the website of Avomeen Analytical Services. |
Atomic Absorption Spectrometry (AAS)
Concept: Each type of element atoms absorb light with specific wavelength.In the AAS machine there is a hallow cathode lamb made of the specific element which is the same as the element to be tested (it means that there is a specific lamp for each element). Let us take lead as an example. To analyse the concentration of lead element in the sample, we need to use the lead cathode lamp. When electricity reaches the lamp, the inert gas atoms (such as neon and argon) inside the lamp will be ionised and bombard the cathode, releasing some lead atoms in excited state. These unstable excited lead atoms will emit light with specific wavelength until they return to their stable ground state. The light emitted can only be absorbed by lead atoms from the sample. Thus the amount of light absorbed is proportional to the number of lead atoms in the sample.
Before the sample solution can be analysed, it will be sucked through a capillary tube and be 'nebulised' - sprayed into tiny droplets and then vaporised by the very high temperature in the sample cell. Bigger droplets will not vaporise but instead become waste solution, which means only 1% of the sample solution will be successfully nebulised. The high temperature causes the lead to becomes atoms, regardless of its previous state. After the light passing through the the lead atom vapour in sample cell, the remaining light will reach the detector and the data will be analysed by the computer.
If we put it in a simpler way,
1) Light emitted
2) Sample vaporised and atomised
3) Light passes through the sample and being absorbed by the atoms
4) Remaining light reaches the detector
 |
| As you can see the sample solution is placed at the polyethylene bottle connected with capillary tube to the machine. The red colour is the flame that vaporises the sample solution. On the right hand side, there are four cathode lamps. (Image taken from the website of Katholieke Universiteit Leuven.) |
Inductively Coupled Plasma - Mass Spectrometry (ICP-MS)
Concept: Ions of the element with respective mass-to-charge ratio are counted by the mass spectrometer.At the beginning, the nebulisation process of the sample solution is just the same as the AAS method. Let us use the same example - lead. The sprayed aerosol containing lead atoms will be directed through the plasma torch in the machine and vapourised into gaseous form. The plasma torch too, contains inert gas such as Argon which is positively charged when heated by the plasma. The lead atom in the vapour will be ionised to Pb+ ions due to the very high temperature, causing them to lose one electron.
Then as the lead ions pass through the machine in an ion beam, neutrals and photons are removed from the beam. As they reach the mass spectrometer, the ion beam which might contain a few types of ions will be sorted according to their mass-to-charge ration, which is unique for each species of ions. The number of ions will be counted as they hit the active surface of the detector. Multiple species of ions can be counted at the same time, unlike AAS, which needs to be repeated element by element.
If we put it in a simpler way,
1) Sample vaporised and ionised
2) Interferences removed in the process
3) Ions reach the detector and are counted
 |
| The sample solution is placed at the side of the machine connected with a capillary tube. (Image taken from Jens Environmental Molecular and Nanoscale Analysis Laboratory.) |
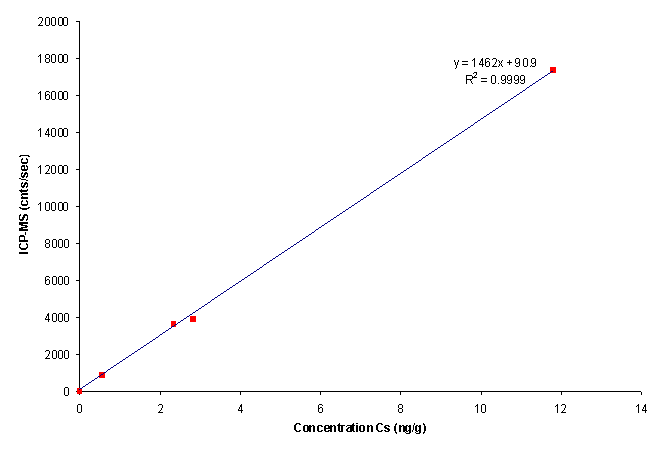
For both AAS and ICP-MS, calibration needs to be done before any analysis. Standard solutions with known different concentrations will be tested and we obtain the data for a straight-line calibration curve with reading detected as the vertical axis and the concentrations as the horizontal axis. After getting a straight line, the unknown concentration of the sample will be analysed based on the graph drawn by the computer system. It means that the results will be based on the calibration curve. If we didn't get a straight-line graph, the results will be inaccurate.
 |
| Calibration curve for AAS. (Image taken from Open Wetware website.) |
 |
| Calibration curve for ICP-MS. (Image taken from the website of Office of Scientific and Technical Information, US Department of Energy.) |
No comments:
Post a Comment